How to plot vector--valued function and its derivative
2 posters
Page 1 of 1

How to plot vector--valued function and its derivative
![]() Dhamnekar Winod Wed Jun 03, 2020 8:55 am
Dhamnekar Winod Wed Jun 03, 2020 8:55 am
I want to know how to plot the following example in the Graphing calculator 3D.
Let f(t)=(cos(t),sin(t),t). Then f′(t)=(−sin)(t),cos(t),1) for all t. The tangent line L to the curve at f(2π)=(1,0,2π) is L=f(2π)+sf′(2π)=(1,0,2π) + s(0,1,1), or in parametric form: x= 1,y= s,z= 2π + s for −∞ < s < ∞.
ha
Now how to show graphically that the derivative of a vector-valued function is a tangent vector to the curve in space which the function represents, and it lies on the tangent line to the curve.
My another question is that why i cann't paste a copied screenshot capture here?
Dhamnekar Winod- Posts : 5
Join date : 2020-06-03
Re: How to plot vector--valued function and its derivative
![]() runiter Wed Jun 03, 2020 9:22 am
runiter Wed Jun 03, 2020 9:22 am
Before I start, in your example your parametric equations use "s" and "t" variable. But in Graphing Calculator 3D, we use "u" and "v" variables in parametric equations. Please always use "u" and "v" when trying to plot parametric equations in this software.
In order to plot parametric function f and its tangent, follow these steps:
(1) Insert a new line and change its graph type from "Equation" to "Parametric".
(2) Type your parametric equation:
x=cos v
y=sin v
z=v
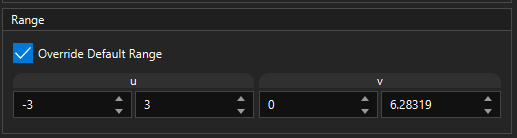
(3) Click on "Override Default Range" and change the "v" range to start from "0" to "2pi":
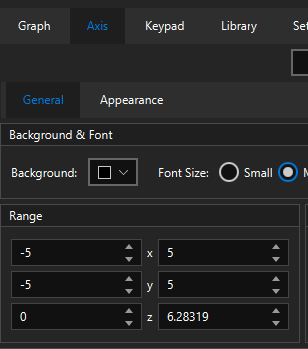
(4) Click on "Axis" tab to change "Range" of z to be from "0" to "2pi"
(5) Insert another line and change it to "Parametric". Type the following equation for the tangent line:
x=1
y=v
z=2pi
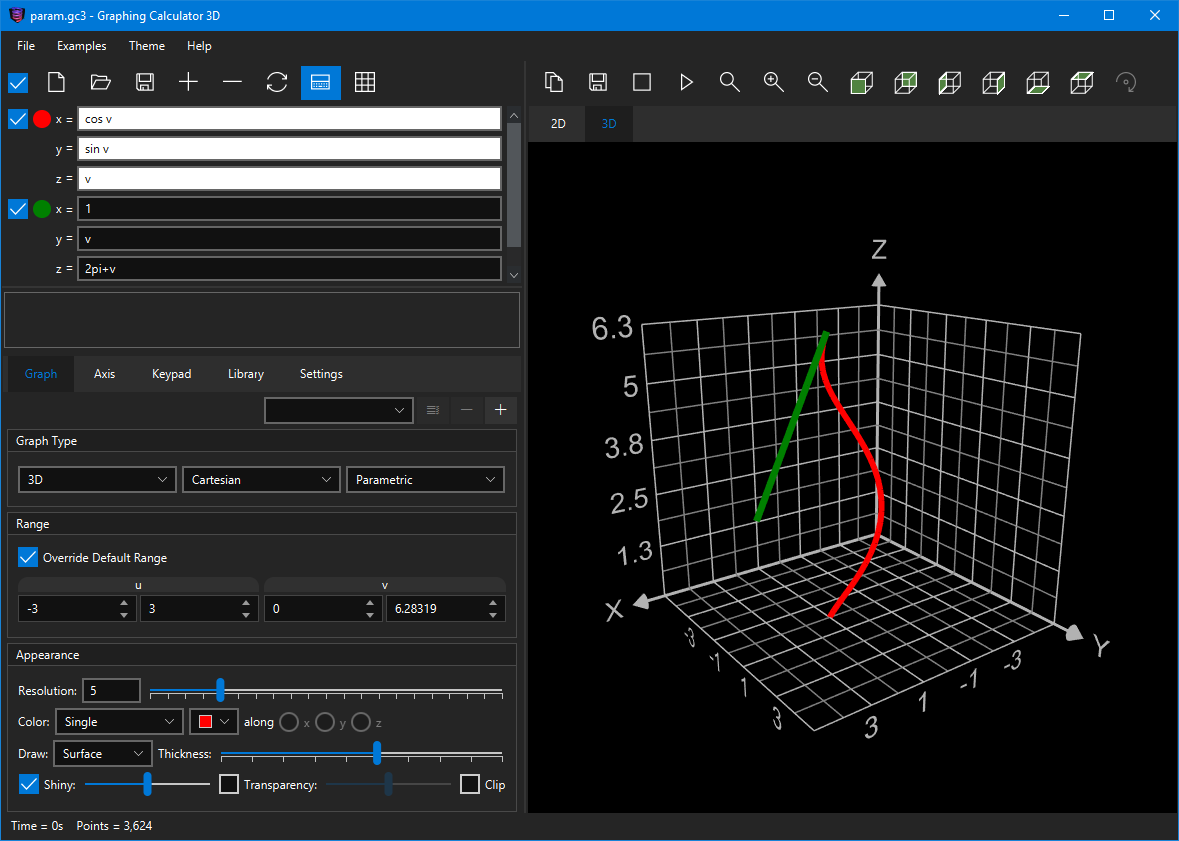
Here is the final result:
To answer your last question, it's true that you cannot paste screenshots directly here. You have to save your screenshot in an image file first. Then click on "Host an image" button here in the forum and then upload your image.
In order to plot parametric function f and its tangent, follow these steps:
(1) Insert a new line and change its graph type from "Equation" to "Parametric".
(2) Type your parametric equation:
x=cos v
y=sin v
z=v
(3) Click on "Override Default Range" and change the "v" range to start from "0" to "2pi":
(4) Click on "Axis" tab to change "Range" of z to be from "0" to "2pi"
(5) Insert another line and change it to "Parametric". Type the following equation for the tangent line:
x=1
y=v
z=2pi
Here is the final result:
To answer your last question, it's true that you cannot paste screenshots directly here. You have to save your screenshot in an image file first. Then click on "Host an image" button here in the forum and then upload your image.

runiter- Admin
- Posts : 147
Join date : 2007-12-05
Age : 43
Location : Boston, MA, USA -

Re: How to plot vector--valued function and its derivative
![]() Dhamnekar Winod Thu Jun 04, 2020 2:35 am
Dhamnekar Winod Thu Jun 04, 2020 2:35 am
Hello,
You have not used "u" variable while plotting the parametric equation of line L,\(L=f(2pi)+ u*f'(2pi)\)x=1, y=u, z=2pi +u for −∞ < u < ∞.
How is that?
Your application relates to mathematics. But why i am unable to use latex or mathjax here to post math symbols
You have not used "u" variable while plotting the parametric equation of line L,\(L=f(2pi)+ u*f'(2pi)\)x=1, y=u, z=2pi +u for −∞ < u < ∞.
How is that?
Your application relates to mathematics. But why i am unable to use latex or mathjax here to post math symbols
Dhamnekar Winod- Posts : 5
Join date : 2020-06-03
Re: How to plot vector--valued function and its derivative
![]() runiter Thu Jun 04, 2020 9:47 am
runiter Thu Jun 04, 2020 9:47 am
You could have use "u" instead of "v" in the example above, but not both.
If you use both "u" and "v" in a parametric equation, the result will be a surface, which is not what you want here.
If you only use one variable ("u" or "v") the result will be a line (or curve) as shown above.
The reason I picked "v" instead of "u" was that in your example you used "t" instead of "s". My understanding is that "t" is equivalent to "v", although in this case it wouldn't make a difference.
As for missing latex and mathjax, unfortunately this is a simple forum that doesn't support those. If there is popular demand, I may switch to another forum provider that does support them in future.
runiter- Admin
- Posts : 147
Join date : 2007-12-05
Age : 43
Location : Boston, MA, USA -
» Vector Functions
» Vector 2 is not declared
» Can I plot just points?
» How can i plot complex number z(t)= r*e^(is)
» Can I plot a 3D graph of random points?
» Vector 2 is not declared
» Can I plot just points?
» How can i plot complex number z(t)= r*e^(is)
» Can I plot a 3D graph of random points?
Page 1 of 1
Permissions in this forum:
You cannot reply to topics in this forum