Plotting the equation of tangent line to a curve
2 posters
Page 1 of 1

Plotting the equation of tangent line to a curve
![]() Dhamnekar Winod Tue Jun 23, 2020 12:49 pm
Dhamnekar Winod Tue Jun 23, 2020 12:49 pm
Hi,
I want to plot the following equation of tangent line to the curve.
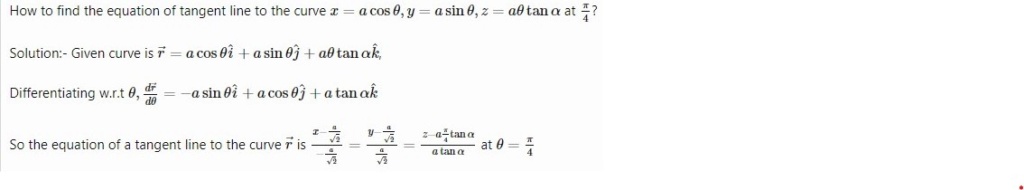
,
My attempt:I put the following graph controls: a=5 α=v=-pi to pi, θ= u= -pi to pi, x-axis=-5 to 5, y-axis=-5 to 5, z-axis=-32 to 32.
Using the above graphing controls, I got the following graph in your Runiter graphing calculator.
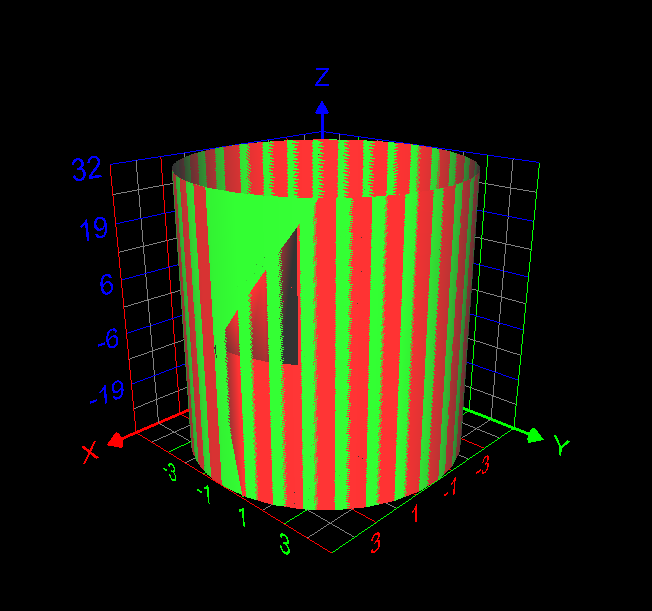
Is this graph correctly plotted? If not, how to plot it correctly?
If any member of this forum knows the correct answer to this question may reply with correct answer.
I want to plot the following equation of tangent line to the curve.
,
My attempt:I put the following graph controls: a=5 α=v=-pi to pi, θ= u= -pi to pi, x-axis=-5 to 5, y-axis=-5 to 5, z-axis=-32 to 32.
Using the above graphing controls, I got the following graph in your Runiter graphing calculator.
Is this graph correctly plotted? If not, how to plot it correctly?
If any member of this forum knows the correct answer to this question may reply with correct answer.
Dhamnekar Winod- Posts : 5
Join date : 2020-06-03
Re: Plotting the equation of tangent line to a curve
![]() runiter Wed Jun 24, 2020 2:36 pm
runiter Wed Jun 24, 2020 2:36 pm
The original curve is a parametric equation that can be plotted simply as this:

But the equation to tangent line is not something I've seen before.
If you can provide a link or description of how vector r=x/something=y/something=z/something is usually plotted then I might be able to help.
But the equation to tangent line is not something I've seen before.
If you can provide a link or description of how vector r=x/something=y/something=z/something is usually plotted then I might be able to help.

runiter- Admin
- Posts : 147
Join date : 2007-12-05
Age : 43
Location : Boston, MA, USA -

» 3D parametric equation with given points
» Can I plot just points?
» Plotting a cube surface
» Can I make a line of best fit?
» Can I plot just points?
» Plotting a cube surface
» Can I make a line of best fit?
Page 1 of 1
Permissions in this forum:
You cannot reply to topics in this forum|
|
|